In this blog post I am experimenting with the out-of-the-box real-time analytics feature of Spring Cloud Data Flow project.
Real-time evaluation of various machine learning scoring algorithms - predictive analytics - as well as simple real-time data analytics based on counters and gauges metrics have been already featured in Spring XD. As the eXtreme Data name suggests, Spring XD project aims to simplify Big Data application development.
Spring Cloud Data Flow
is the cloud native redesign of Spring XD. It unifies stream and task (batch) processing for data microservices, across modern cloud 


 runtimes
or on-premise. For this post, I am going to usecase the last one.
Prerequisites
Assuming you have already Java (Java 8 or later) and Maven installed, perform the following steps:
1) Start up a local instance of Redis:
$ wget http://download.redis.io/releases/redis-4.0.2.tar.gz
$ tar xzf redis-4.0.2.tar.gz
$ cd redis-4.0.2
$ make
$ src/redis-server
Redis is only a dependency with Spring Cloud Data Flow when running any streams that involve analytics applications. Later you will be able to list the
counterkeys as below:$ src/redis-cli 127.0.0.1:6379> keys fieldvaluecounters* 127.0.0.1:6379> keys spring.metrics.counter*
2) Each Spring Cloud Data Flow stream or task is actually a distributed application (Spring Boot based microservice that runs in a different process) and are bound together via message brokers. That is why either RabbitMQ or Kafka needs to be installed. I will be using the Apache Kafka Binder for this experiment. Download and installation instructions can be found here.
3) Download and run Spring Cloud Data Flow’s Local server:
wget http://repo.spring.io/release/org/springframework/cloud/spring-cloud-dataflow-server-local/1.2.3.RELEASE/spring-cloud-dataflow-server-local-1.2.3.RELEASE.jar
java -jar spring-cloud-dataflow-server-local-1.2.3.RELEASE.jar
The local Data Flow by default uses embedded H2 database for storing stream, task and app states.
I’ve tried as well current milestone version spring-cloud-dataflow-server-local-1.3.0.M2.jar, however the Analytics Dashboard is still under active development to support d3.js charts with the new Angular 4 based Dashboard UI.
4) Download, launch and connect to Spring Cloud Data Flow’s shell:
wget http://repo.spring.io/release/org/springframework/cloud/spring-cloud-dataflow-shell/1.2.3.RELEASE/spring-cloud-dataflow-shell-1.2.3.RELEASE.jar
java -jar spring-cloud-dataflow-shell-1.2.3.RELEASE.jar
The Spring Could Data Flow server exposes a REST API for composing and deploying data pipelines. The shell makes it easy to work with the API from the command line.
5) Twitter credentials from Twitter Developers site. Eventually you might check with Postman that your credentials are working.
Data Pipelines and Stream Orchestration
Spring Cloud Data Flow allows you to build streams declaratively using a familiar pipes and filters syntax based on the Unix model. The Unix command is replaced by a Spring Cloud Stream application and each pipe symbol represents connecting the input and output of applications via messaging middleware, in this case Apache Kafka topics.
To ingest data from a Twitter stream and simply dump its output to the console log, you can define the following data pipeline: twitterstream | log, whereby twitterstream and log are built-in source, respectively sink applications.
If you were keen on doing some processing on the JSON tweet message payloads, the data pipeline may look as: twitterstream | filter | transform | log, whereby filter and transform are built-in processor applications using SpEL expression language.
In preparation for the next step of deploying the streaming data pipeline, you will need to register
the Kafka binder variant of out-of-the-box applications using Spring Cloud Data Flow’s shell:
dataflow:>app import --uri http://bit.ly/Bacon-RELEASE-stream-applications-kafka-10-maven
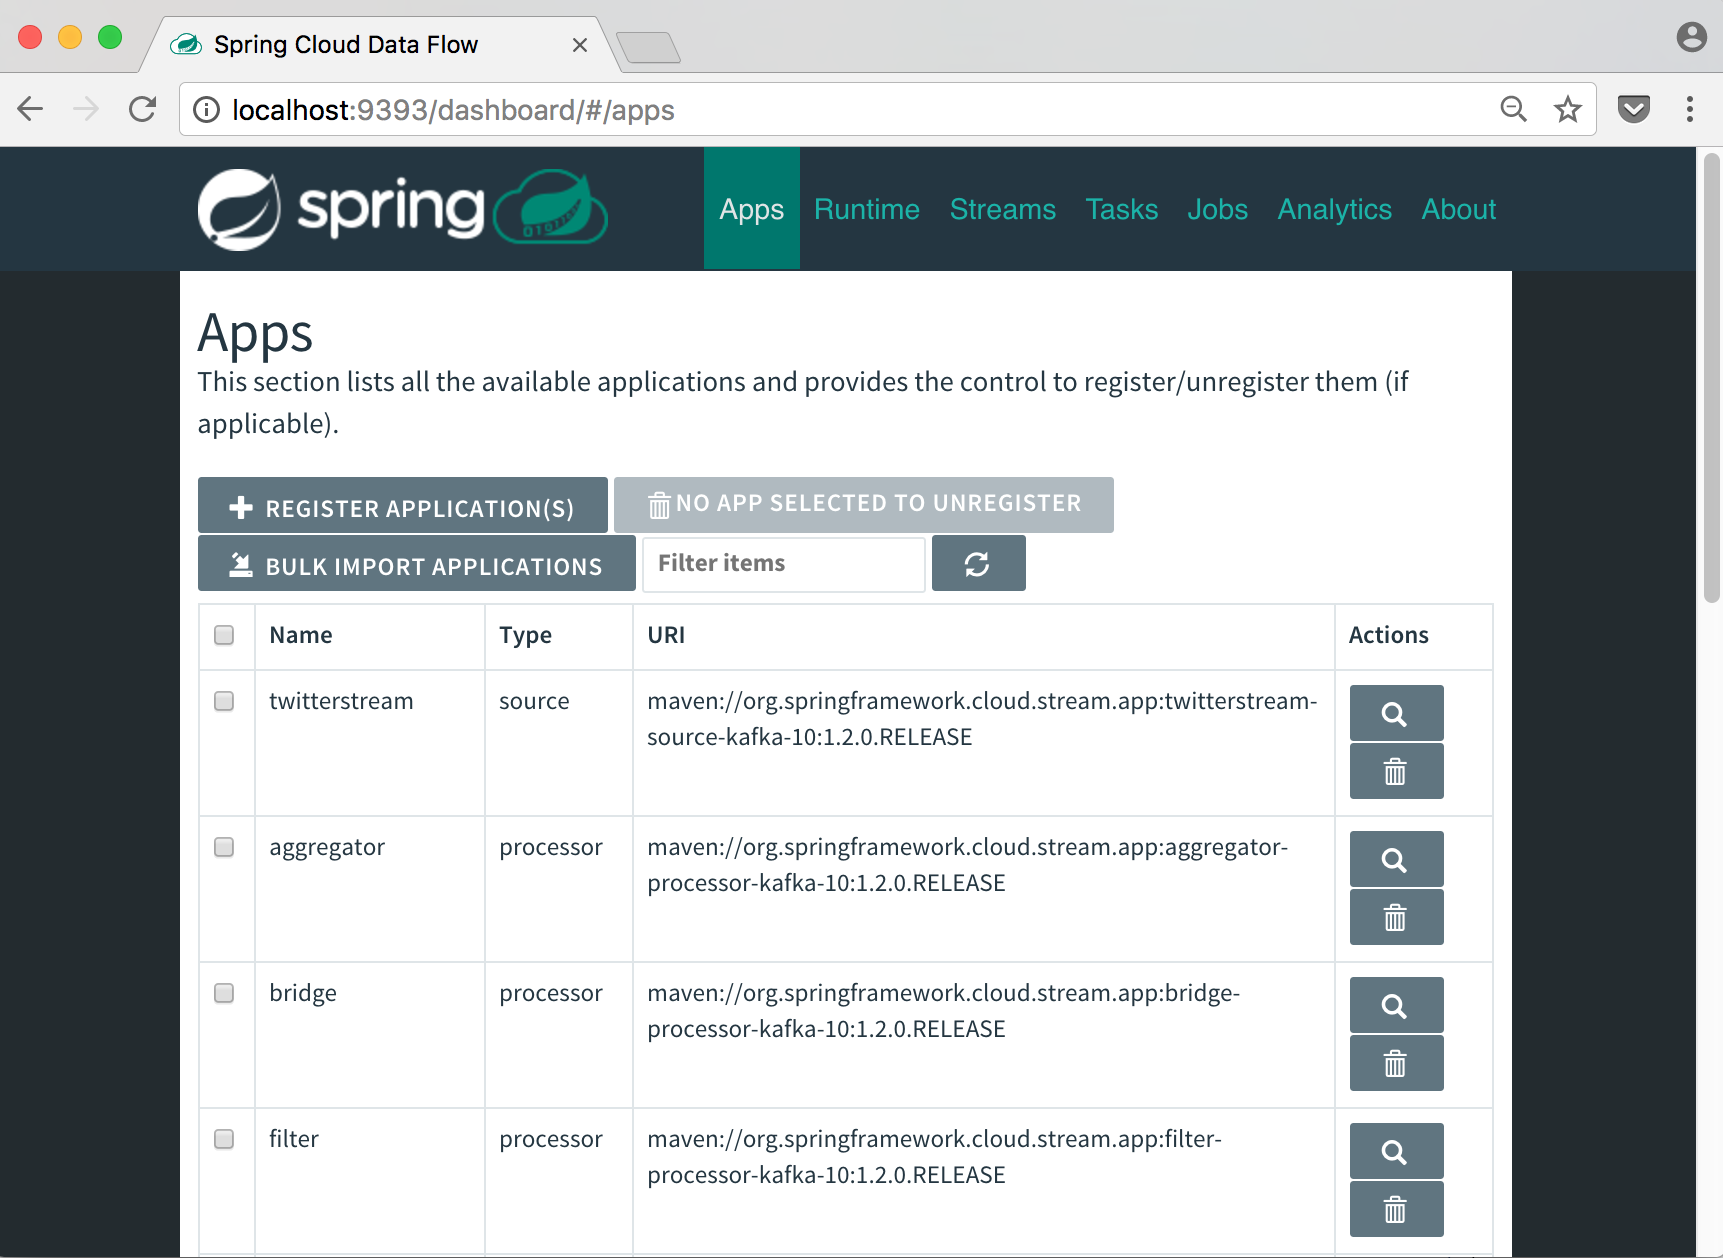
You will be able to see the result in the Spring Cloud Data Flow UI Dashboard, within the Apps Tab:
Deploy Streams and Ingesting Data from Twitter
Using Spring Cloud Data Flow’s shell again, I am issuing three commands to create streams that
consume real-time tweets in Dutch, Hungarian, Hebrew and Japanese languages, count the number of occurrences of each distinct hashtag and language in consumed tweet payloads.
dataflow:>stream create langbasedtweets --definition "twitterstream --language=‘nl,hu,he,jp’ --consumerKey=<CONSUMER_KEY> --consumerSecret=<CONSUMER_SECRET> --accessToken=<ACCESS_TOKEN> --accessTokenSecret=<ACCESS_TOKEN_SECRET> | log" --deploy
Created new stream 'langbasedtweets'
dataflow:>stream create langbasedhashtags --definition ":langbasedtweets.twitterstream > field-value-counter --fieldName=entities.hashtags.text --name=langbasedhashtags" --deploy
Created new stream 'langbasedhashtags'
Deployment request has been sent
dataflow:>stream create languagedistribution --definition ":langbasedtweets.twitterstream > field-value-counter --fieldName=lang --name=languagedistribution" --deploy
Created new stream 'languagedistribution'
Deployment request has been sent
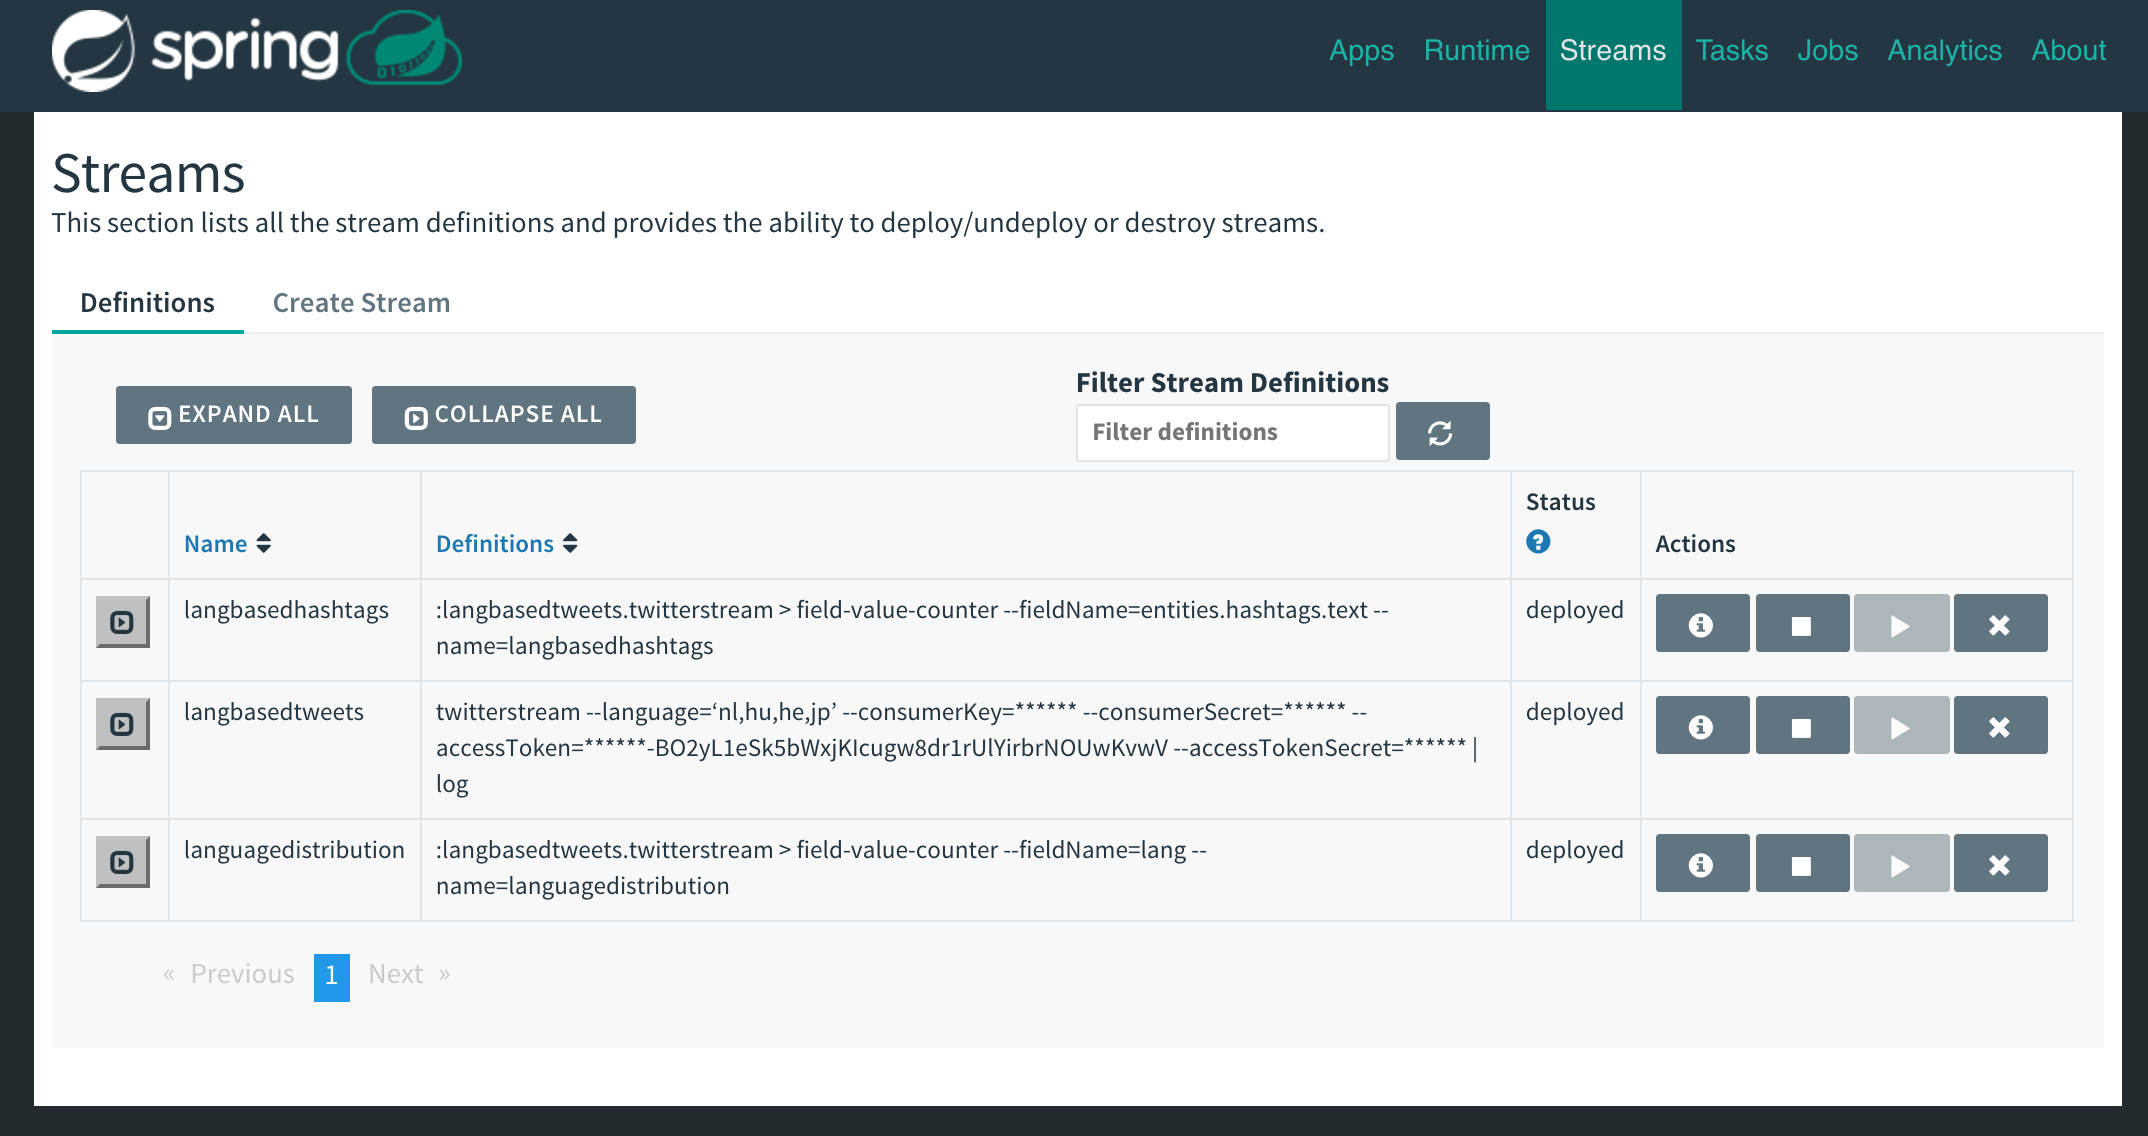
Streams runtimes deployed and visible via the Dashboard UI Streams menu option :
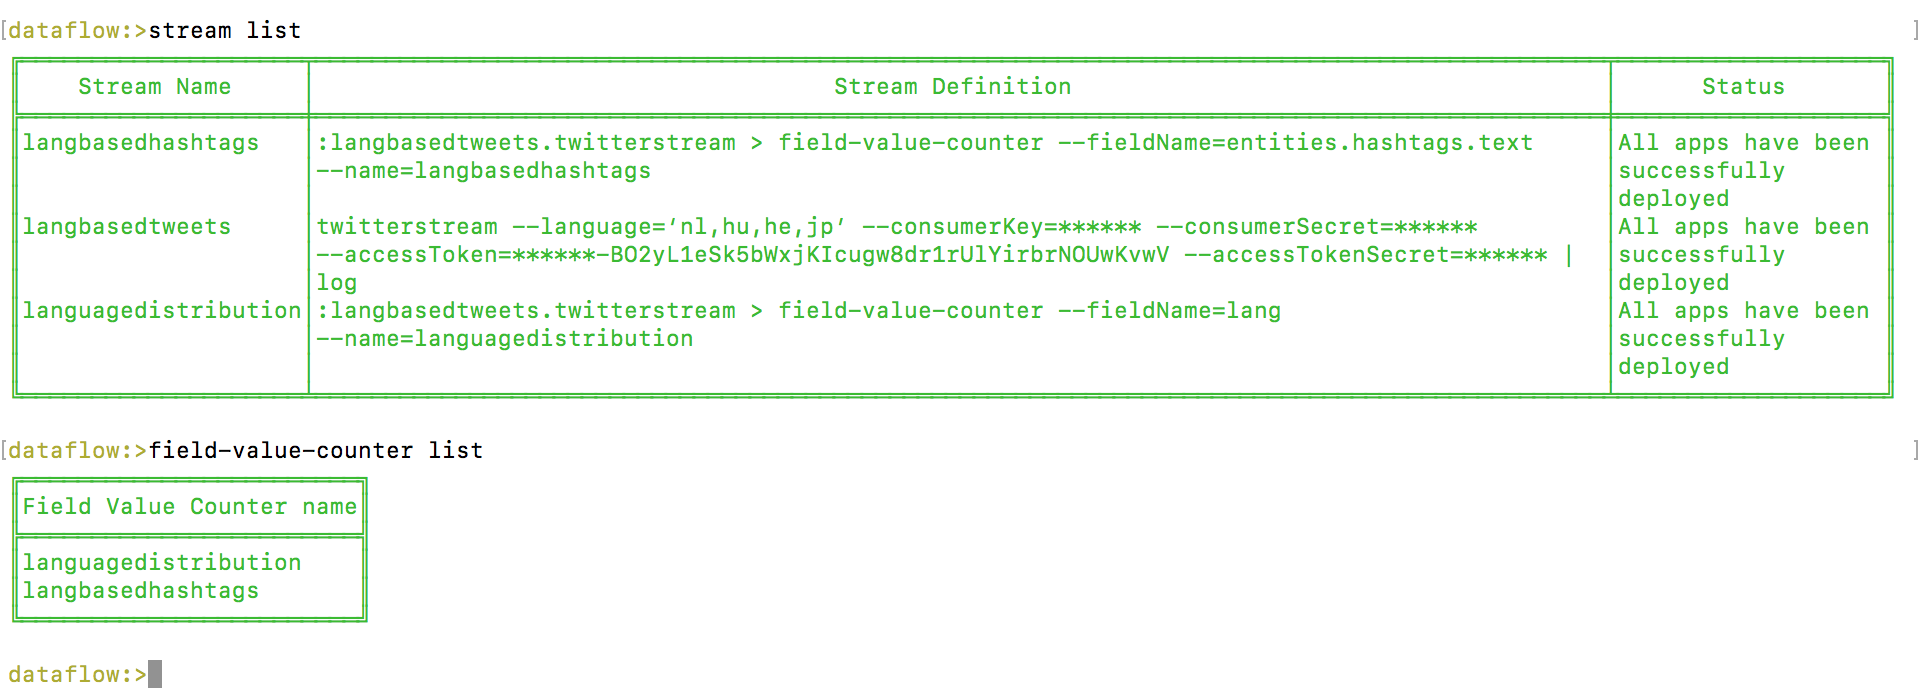
Query via the shell:
The types of counter metrics supported are:
| Counter | Field Value Counter | Aggregate Counter |
|---|---|---|
| Counts the number of messages it receives, optionally storing counts in a separate store such as redis | Counts occurrences of unique values for a named field in a message payload | Stores total counts but also retains the total count values for each minute, hour day and month |
Real-time Analytics Dashboard
Current milestone version 1.3.0.M2 has undergone a revamp of the Dashboard UI from Angular 1.x to Angular 4. While most of the menu options are already fully operational, the Analytics Dashboard is still undergoing upgrades to port field-value-counter and aggregate-counter D3.js widgets to the Angular 4 infrastructure. Therefore I have chosen to use 1.2.3.RELEASE version of the Analytics Dashboard for my Twitter API experiment.
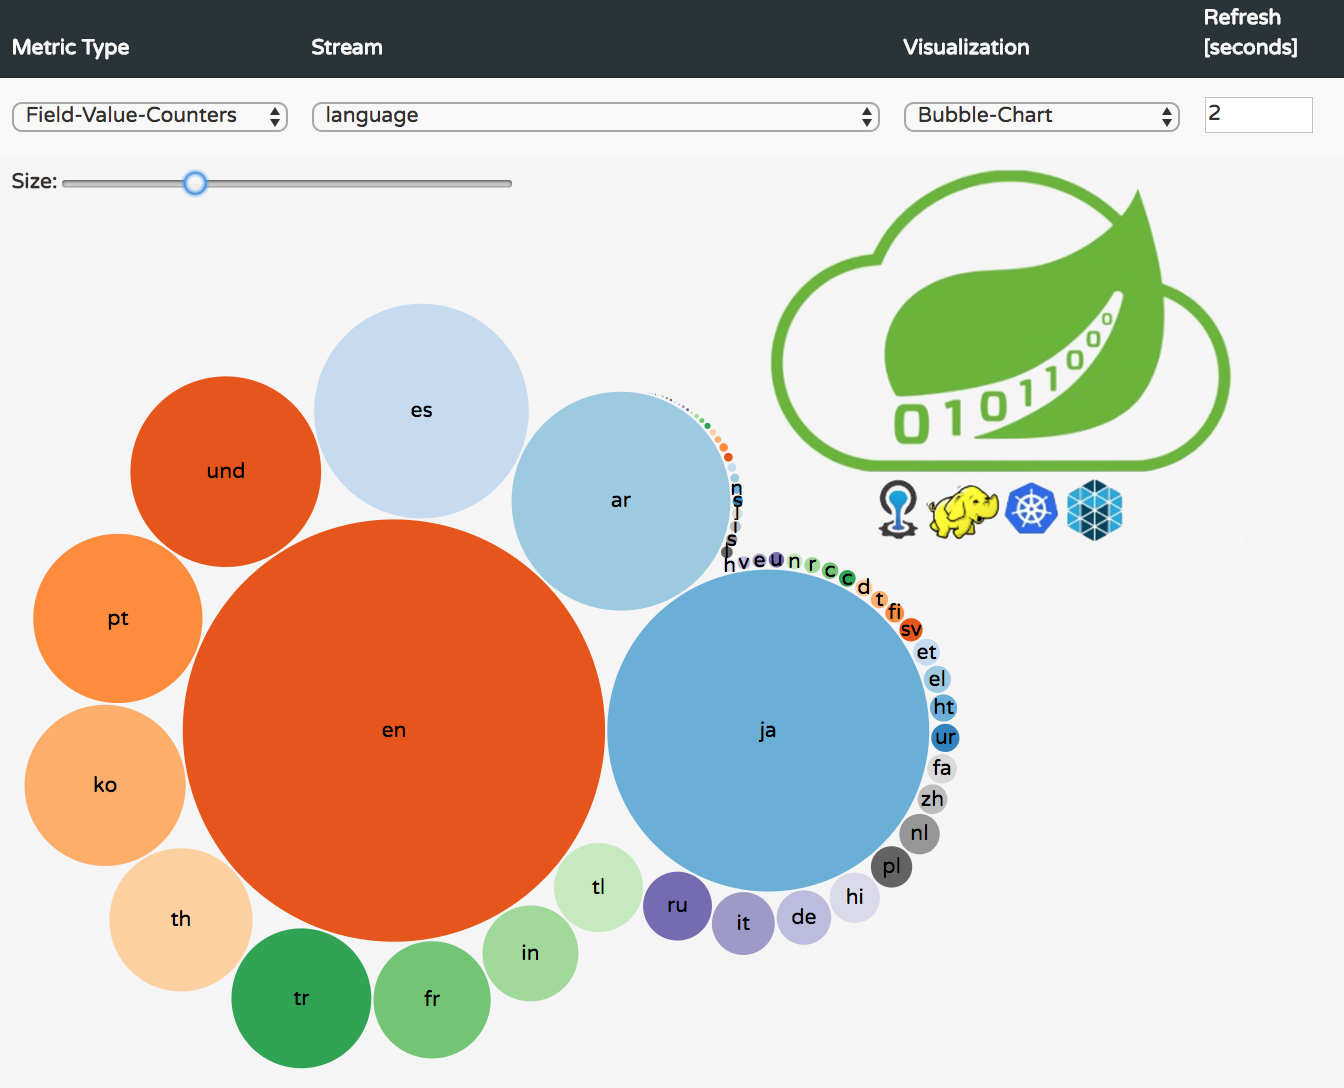
Ta da! 🎉 below some screenshots of the bubble and pie charts for the hashtags text and language field-value-counters.
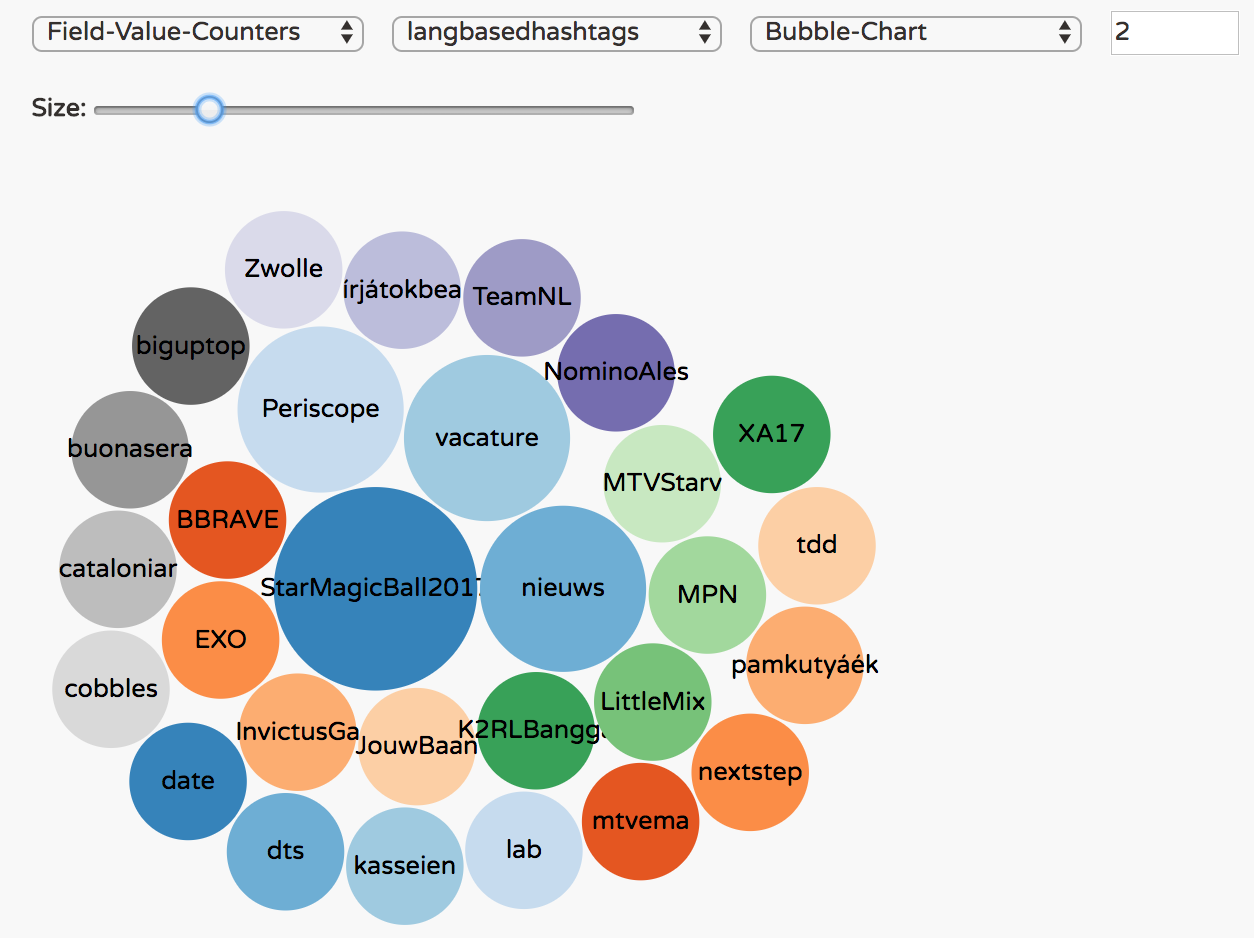
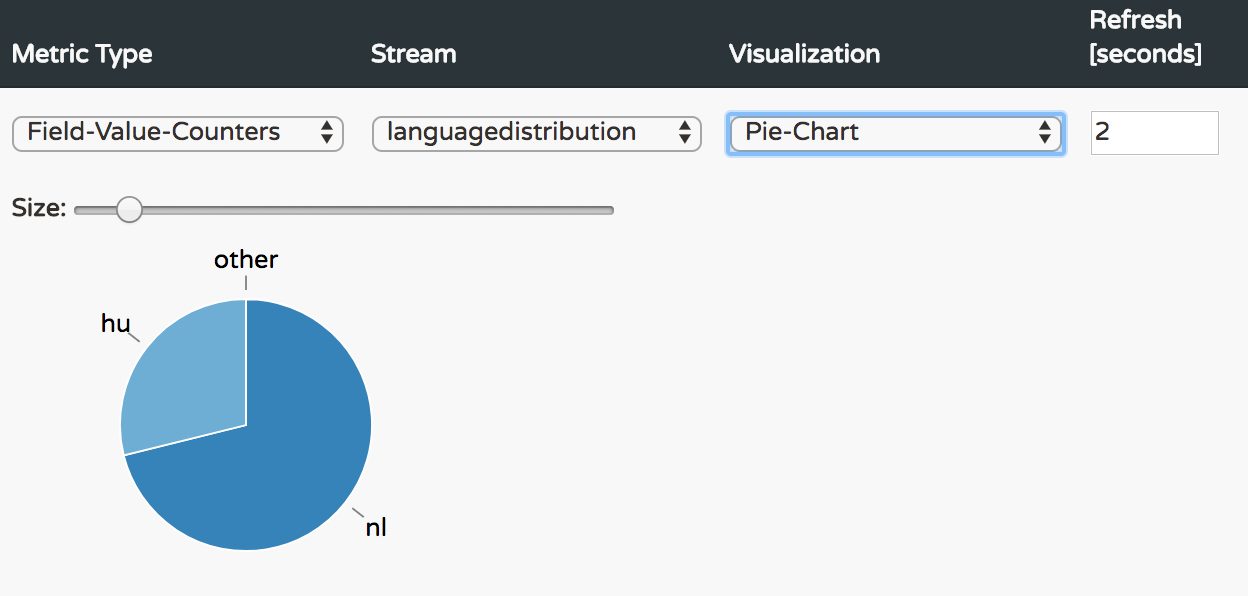
The analytics for real-time streams can be applied to any other source application, not only the twitterstream, of course with a bit of coding. Think of trending products in an e-commerce application.
Thank you for reading and happy data visualisation!
